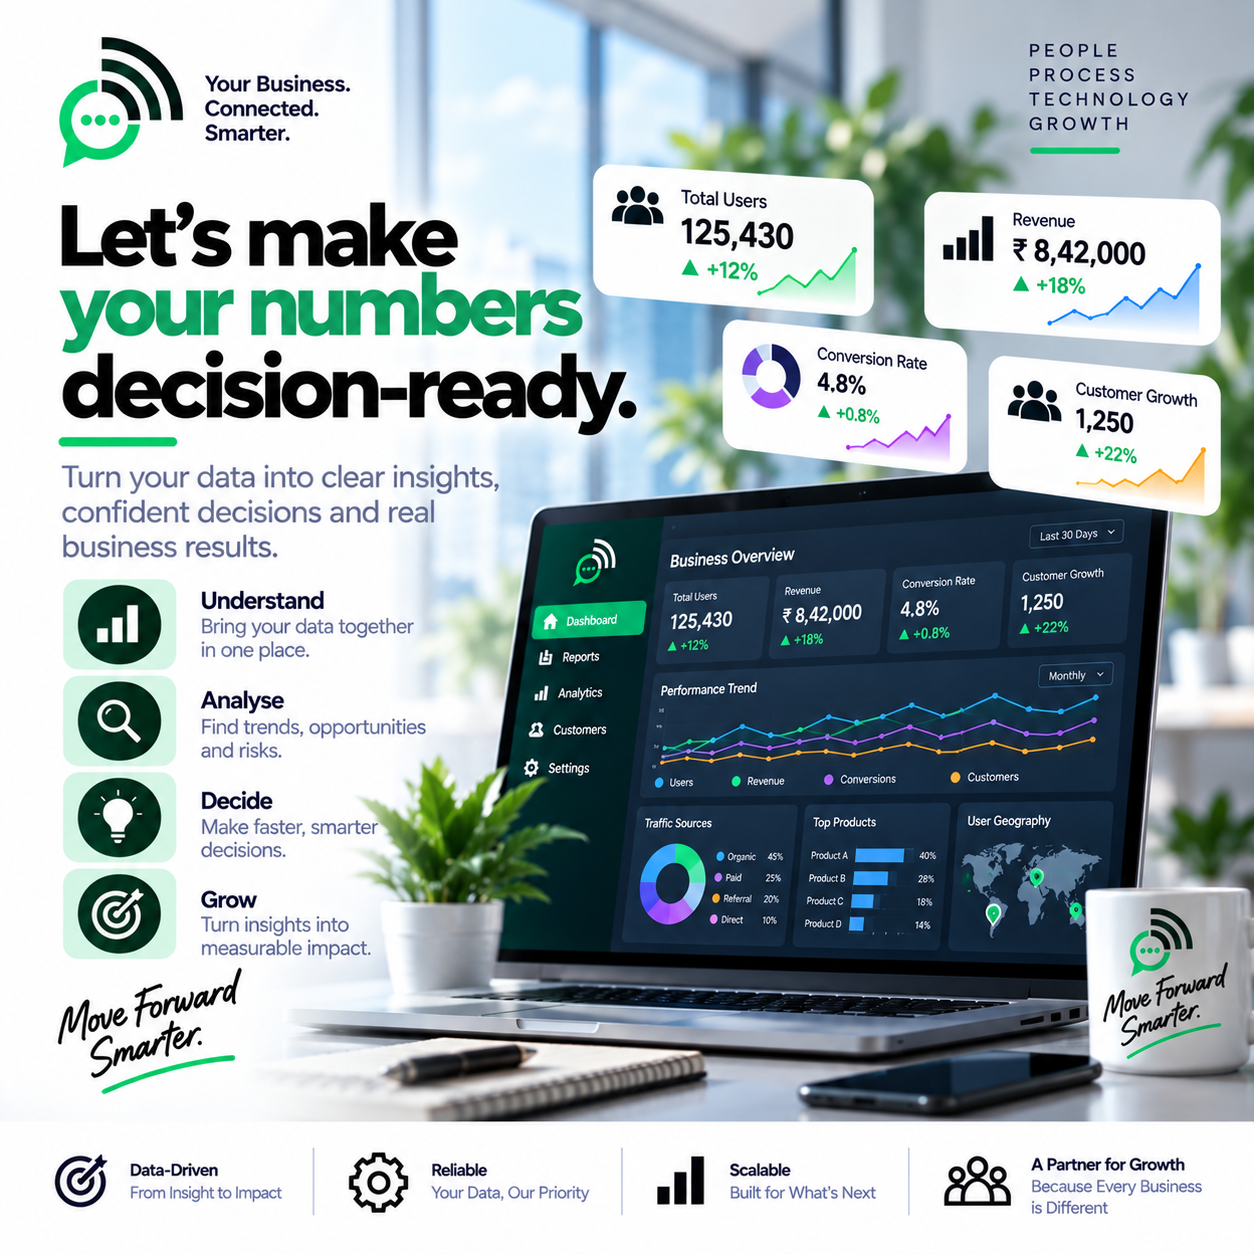
Clear business dashboards
Give leaders and operators views that answer real questions.
Data Analytics
Build pipelines, dashboards, and insight systems that help teams understand performance, spot opportunities, and decide faster — with trustworthy data underneath.
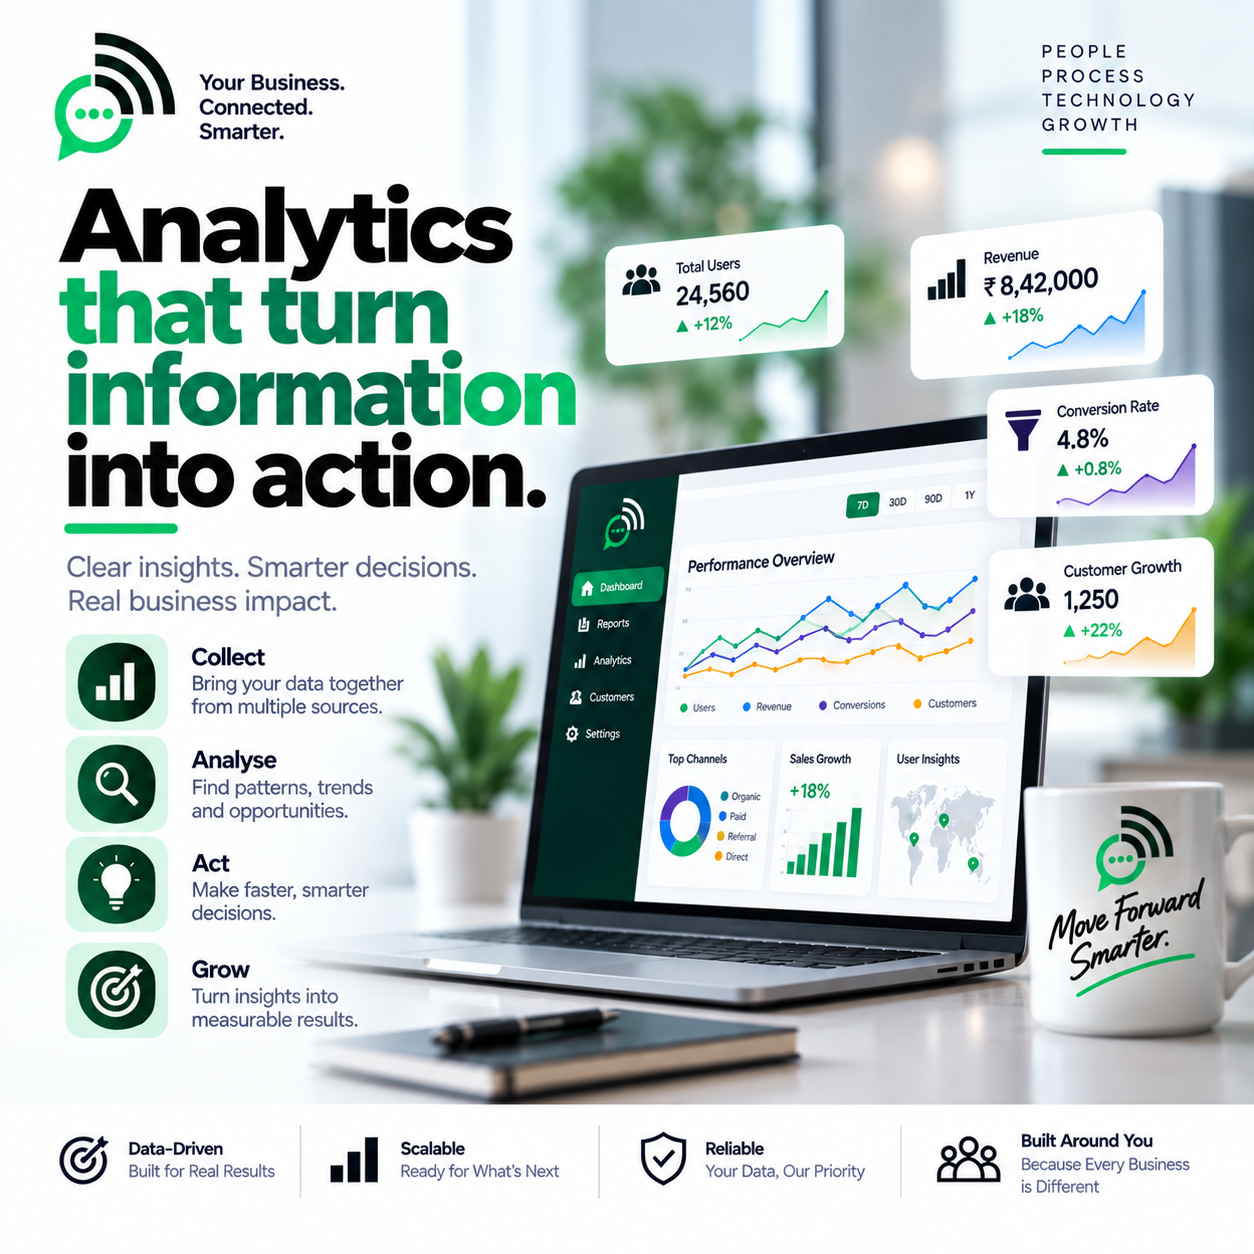
Give leaders and operators views that answer real questions.
Move data with freshness, quality checks, and known ownership.
Surface what changed and what to do next — not just charts.
Align teams on definitions so debates focus on action, not numbers.
The challenge
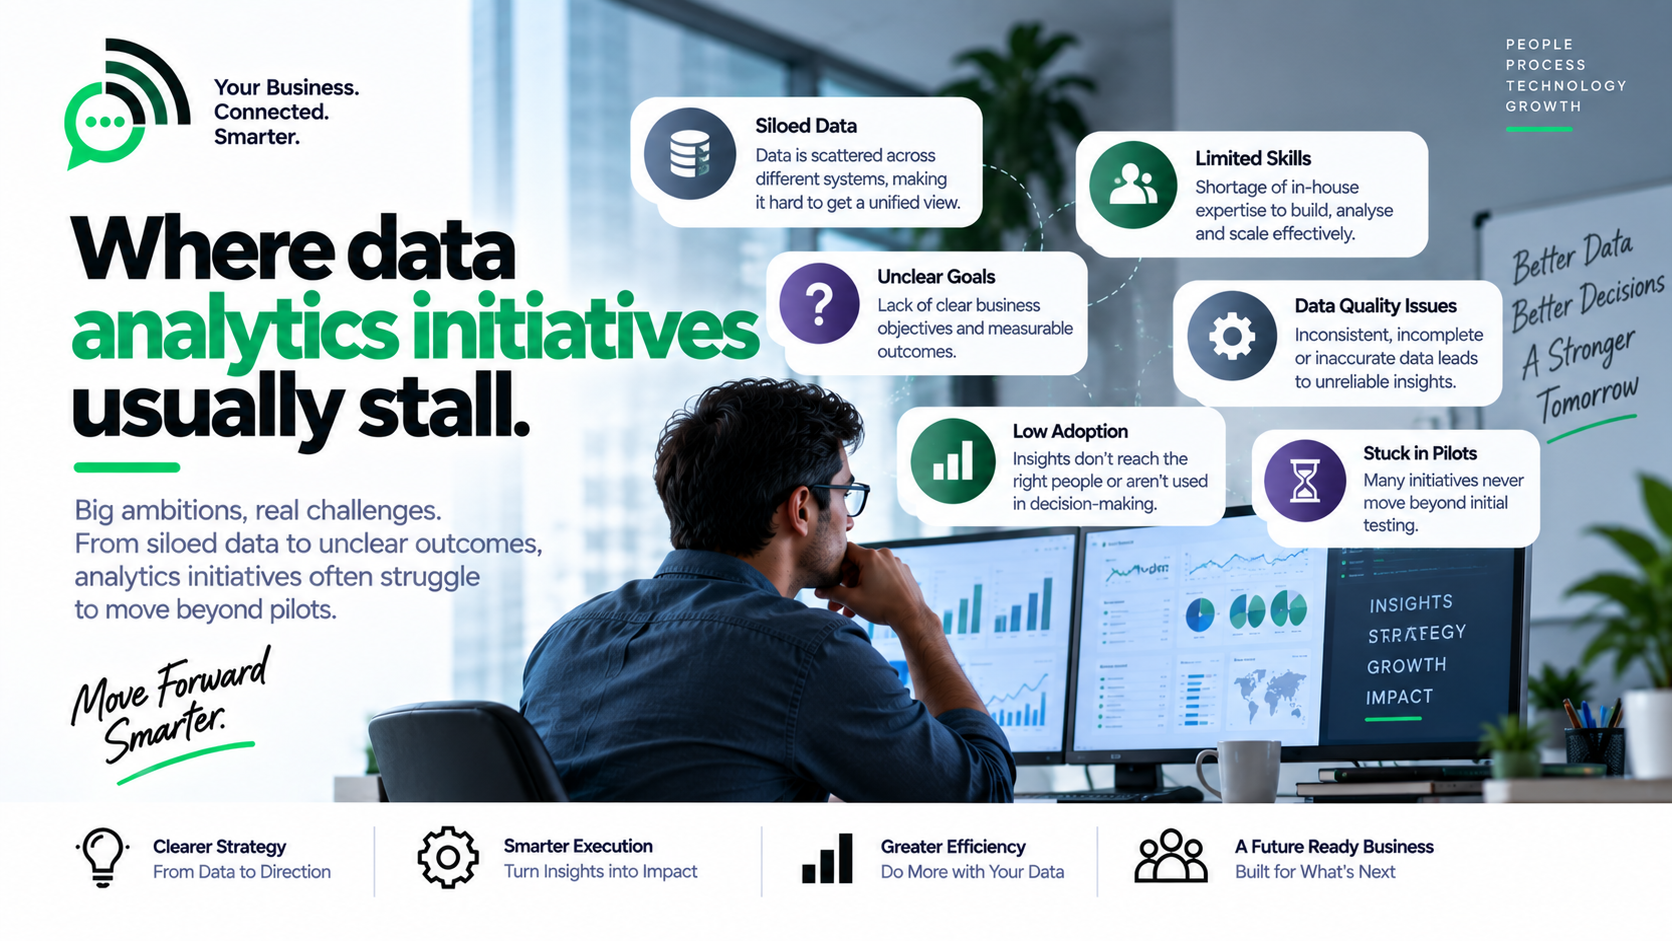
Before we design the system, we map the friction that slows teams, hides ownership, and creates avoidable delay.
Every team has a spreadsheet truth, so meetings stall on reconciliation.
Pretty charts fail when freshness, lineage, and definitions are unclear.
Product, sales, and ops data never meet — so insight stays partial.
Expected outcomes
The SynkRoot approach
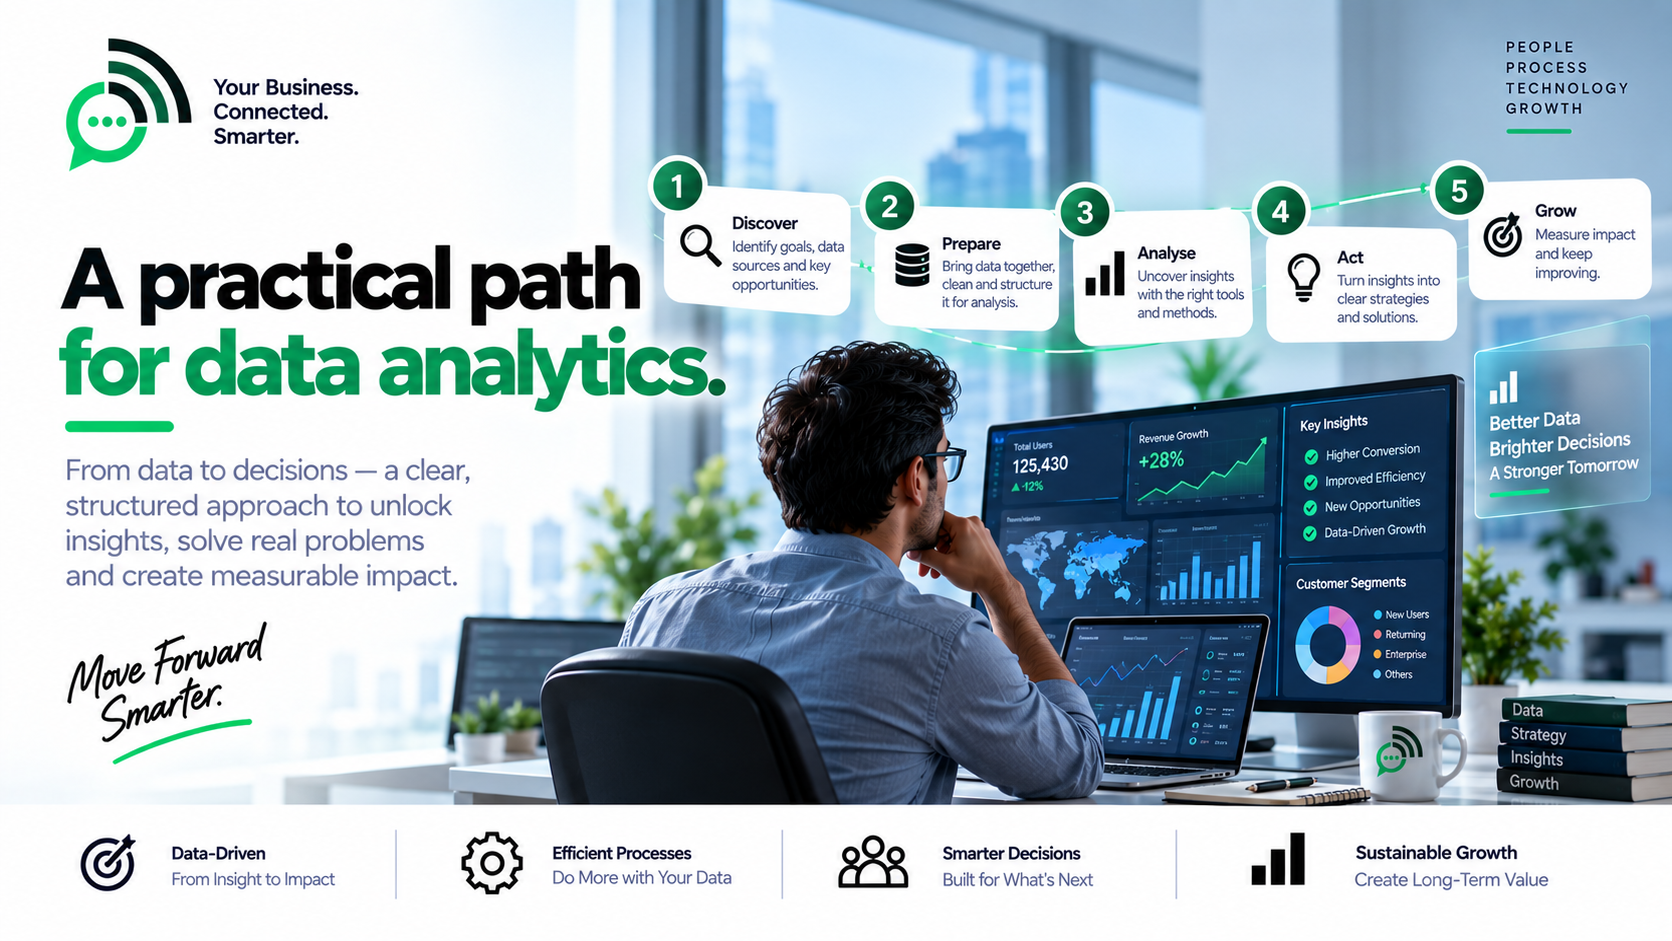
We build analytics as an operating system for decisions — trusted definitions, reliable pipelines, and views shaped around the questions teams ask every week.
SynkRoot data analytics solutions help businesses build trusted pipelines, dashboards, and insight systems so teams can decide faster with numbers they believe.
Analytics creates leverage only when definitions are shared and data is trustworthy. Otherwise dashboards become decoration.
SynkRoot builds analytics around decisions — metric ownership, reliable pipelines, and views operators will actually use.
What’s included
Every data analytics engagement is designed for real delivery — not buzzwords or slide decks.
Align on what success means before investing in pipelines and charts.
Ingest, transform, and validate data with clear freshness expectations.
Structure data so reporting stays coherent as sources multiply.
Build views for different altitudes — strategy and day-to-day control.
Understand behaviour, funnels, and retention with trustworthy events.
Control who sees what while keeping insight accessible to decision makers.
Business impact
Shared definitions end meetings that only reconcile numbers.
Ops views surface issues before they become monthly surprises.
Behaviour data guides roadmap choices with evidence.
Foundations support new reports without starting from zero.
Use cases
Practical data analytics scenarios we design and deliver around — with clear scope and measurable outcomes.
Who it’s for
How we work
We start from the questions leaders and operators must answer weekly.
We agree definitions and map sources before building fragile charts.
We deliver trusted data flows and dashboards people will actually open.
We add quality checks and refine metrics as the business learns.
What you receive
Technology
Current, proven tools chosen for this capability — then supported by the same team that designs and ships it.
FAQ
Common questions teams ask before choosing a data analytics engagement with SynkRoot.
Not always. We start with the decisions and sources that matter, then grow foundations as value is proven.
More technologies
Let’s build what’s next
Tell us which decisions stall today — we will shape analytics foundations and views your teams can trust.